IG’s purpose is "Powering the pursuit of financial freedom for the ambitious". Established in 1974 as one of the world’s first providers of financial derivatives to retail traders, it continued leading the way by launching the world’s first online and iPhone-based trading services. IG is a member of the FTSE 250, with offices across Europe, including a Swiss bank, Africa, Asia-Pacific, the Middle East, and North America.
IG is an award-winning, multi-product trading company that allows retail, professional, and institutional clients to trade 24 hours a day, 7 days a week. IG is the world’s No. 1 provider of contracts for difference (CFDs) and a global leader in foreign exchange (forex) derivatives. It provides leveraged services with the option of limited-risk guarantees and offers an execution-only stock trading service in the UK and Australia.
IG needed a technology health check to make an assessment of applications across their global technology estate. They also wanted a complete overview of the data to identify strengths, vulnerabilities, and improvement opportunities.
In 2020 they executed a company-wide overview using a manual spreadsheet rather than a dedicated tool. The data took weeks to gather but then quickly went out of date. This process clarified IG’s need for a tool that could:
- Be a single source of truth
- Provide a faster way to gather information
- Have broader Application Portfolio Management with an easily maintainable As-Is state
- Align business and technology
- Give consistent architecture collateral for project risk assessment
- Adapt to short and long term objectives
- Create visualizations, presentations and come with built-in surveys
- Help IG move from reactive to proactive data analytics and reporting
The Enterprise Team took a strategic approach when presenting their case to senior management. They successfully demonstrated that IG needed a tool to keep an up-to-date central repository that was enterprise-based. The team was given the green light to take on the task.
Meet the IG Enterprise Team
An effective team is the sum of its members’ hard work and cooperation. IG has a powerful team led by IG’s Principal Architect, Tricia Deane that helped to drive the application health check.
The Enterprise Team gave themselves 6 months for their first strategic objective: finding the right tool. They wanted a tool that could build their central repository, easily manage and process data, and offer automation for quick results. They went through a comprehensive Request for Proposal (RFP) process and tested multiple vendors. Ultimately they found that Ardoq met their requirements by giving them:
- Excellent playbook of use cases
- Modern and clean UI
- Highly configurable
- Superior metamodel approach
- Automated reporting and graphical capabilities
- Built-in presentation tool
- Robust ServiceNow integration
Tricia said that, “with Ardoq, we have a very flexible and configurable tool, which we can build up incrementally over time.”
Seamless Assessment for the Technology Health Check
Ardoq simplified and enriched the technology health assessment. By keeping their metamodel simple, the team was able to focus their workspace areas on business domains, IT services, applications, and people. This allowed them to combine inputs and import information from ServiceNow.
Next, using Ardoq’s Surveys and automation the team sent out initial questionnaires. Tricia said, “It's a simple but huge thing which created a consistent window into what we were trying to achieve. It allowed us full coverage in terms of the questions we wanted to articulate and enabled us to capture some additional information around things like technology versions, data domains, out-of-support technology, and programming languages.”
The Enterprise Team trained architects to use the tool. Compared to the previous year, they halved their data-gathering time using Surveys and automations. As the data arrived, the dashboard tracked KPIs and core data, working in parallel with the exercise. The minute the team closed the survey, they could start the number crunching - cutting down the data analysis time.
Key benefits of the analysis include:
- Richness of data
- Improved communication capabilities from the analysis tool
- Perspectives, visualizations, and dashboards
Within 6 weeks over 1,200 questionnaires were finished. This was much smoother than the previous year. Tricia added that, "The hardest thing was figuring out what questions we were going to ask. However, once we had these, we had quite a pain-free journey through completing the survey." Further enhancements have been made to the platform since they ran the health assessment.
The team had the tools and means to succeed. Now they needed the buy-in on all levels and from across the business.

Creating C-Suite Support Using Visualizations and Narratives
Tricia knew her team needed to deliver value from the first presentation, especially to the C-suite. The focus was to convey relevant information to support the key business drivers in a meaningful way. In doing so, the team were able to have an enhanced view of the technology estate used in decision making,
The team played to their strengths. One member used his analytical and storytelling skills to build the presentation. Others added their expert knowledge. They focused on several key goals. To provide a service and a function that better supports the business, showing how we help drive architecture to inform the strategic roadmap and support change programs. The end product was a narrative that took people on a journey. It translated architecture into something digestible and conveyed total value to the stakeholders. Finally, they filtered the information by who would receive it, creating accessible and tailored presentations for everyone in the organization, including the CEO.
Tricia presented the story of the health check to the C-suite. It explained the general state of the company’s technology, showing high scores across business-critical, client-facing, and trading technologies.
The central repository showed a few areas with low-scoring technology. For these, Tricia could quickly answer senior stakeholder questions and explain the numbers. Additionally, the Enterprise Team showed high-risk areas and presented their delivery plans for these focus areas in a follow-up meeting with the CEO.
“We've moved the dial on understanding the health of our technology hugely, and Ardoq has a big part to play in that. We've been able to survey, store and analyze the data. Use of the tool improved on our previous health assessments and gave us an enhanced insight into our IT estate and enabled us to forward plan any modernisation activities.”
- Tricia Deane, Principal Architect, IG
Showing, Not Telling
The Enterprise Team found that the quickest path to stakeholder buy-in involved taking an indirect approach. This meant emphasizing outcomes and benefits, and communicating to stakeholders about priorities in their language.
Tricia said “We started with the procurement of Ardoq and doing the health assessment. Now we've positioned the results of our assessment, giving us an enterprise-wide view, showing how our team drives value with the outcomes we are delivering.”
The team worked by showing, not telling. By doing this, stakeholders understood the benefits of the technology repository and automation to maintain an As-Is state. It was clear how they gave valuable KPI information and significantly sped up the annual health assessment. The approach worked, and people’s mindsets began to change.
The Enterprise Team could turn the data into a dynamic visual story that showed the C-Suite the value of a complete health assessment. The result was getting an As-Is central repository up and running in less than 6 months.
In addition, stakeholders saw the value of the enterprise team’s request to use Ardoq for information and data gathering. The technology and driving change demonstrations are paying off. Internal teams, even those beyond IT, see the value of architecture. They are asking if they can use Ardoq features, such as Surveys, for other types of data collection.
Generating Future Value
The Enterprise Team is adding value to the next stage of their roadmap by extending both technology and business context. With visualizations and dashboards designed, tested, and implemented, the 2022 survey for the health check should go smoothly.
They understand how the system works and the key people are trained in using Ardoq. It will be, in principle, a ‘rinse and repeat’ exercise saving the team’s time and effort. The survey tool is able to provide the team with their first comparative data for year-on-year performance. With Ardoq, the team now has a common data set, process, and outputs.
We look forward to revisiting this talented team in the future to see how they’re doing as they continue to implement architecture by speaking the language of the stakeholders and as they build their roadmap.
“We're very much driving our storytelling, by pulling data and information from Ardoq into our decks to then present it. Now we clearly see our health score and can continually improve upon it.”
- Tricia Deane, Principal Architect, IG
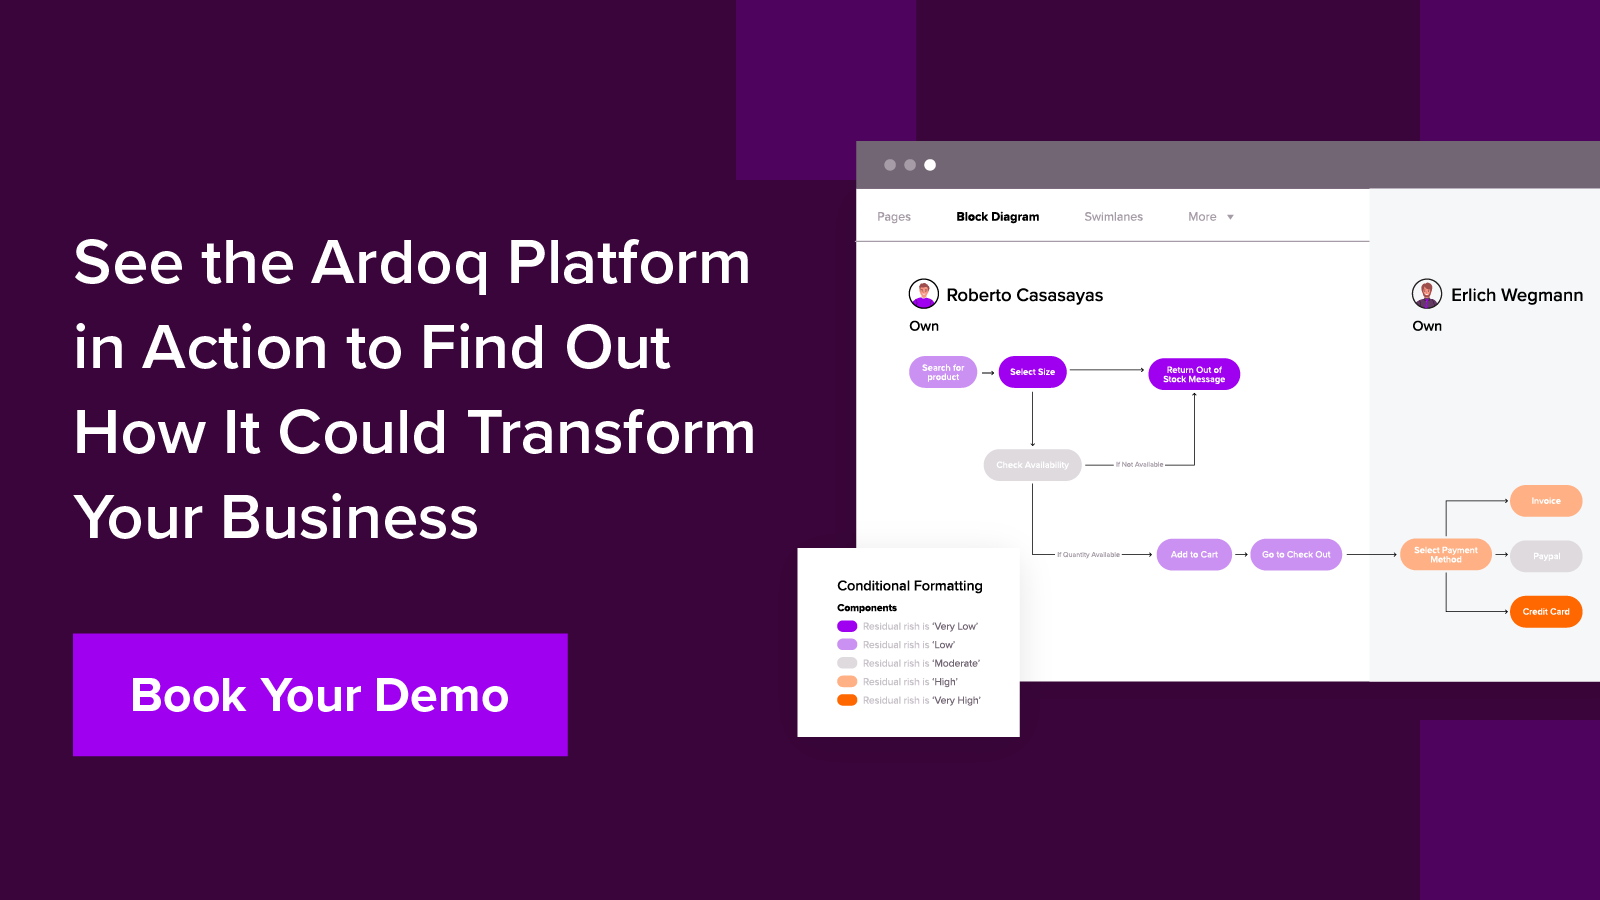
Find out more about how IG built their central repository for their technology health check by seeing the tool they used in action. Book a demo with an Ardoq specialist.
 Ardoq
This article is written by Ardoq as it has multiple contributors, including subject matter experts.


/Logos/Ardoq/RGB_Ardoq_Logo_Stacked_White_Monochrome%201.png?width=80&height=77&name=RGB_Ardoq_Logo_Stacked_White_Monochrome%201.png)

