- Enterprise ready, cloud-native SaaS platform
- Graph technology for better data structure and insights
- Highly-configurable metamodels to match your evolving needs
- Ready-to-use solutions for fast time to value
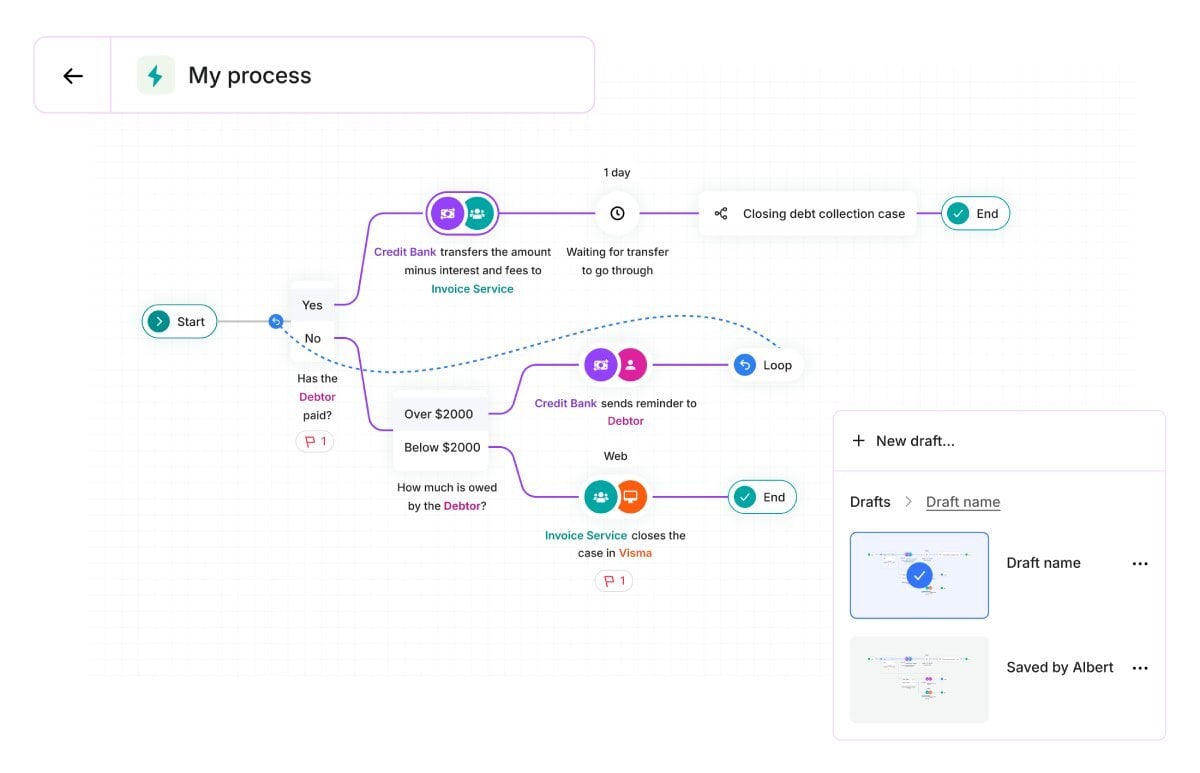
Stakeholder Engagement
Gain Traction and Build TrustStakeholder engagement is the most critical factor in your digital transformation projects. Use collaboration-focused tooling to meet your colleagues where they work.