Discover how the lessons of yesterday have informed the solutions of today.
Before Erik and I started Ardoq, I was the Lead Integration Architect for a large integration project. The project covered many systems and hundreds of services that we had to design, orchestrate and integrate. Instead of drawing diagrams by hand, we ended up using Excel to control the integration chaos.
Responsibilities
One of my responsibilities was to identify all of these existing services, make sure that we could either re-use them or have them re-designed. To do that, I had to visualize every integration and document them via sequence diagrams or process flows showing the orchestration.
A lot of the existing services were procedural programs running on large mainframes exposed via message queues (MQ). These services all had dependencies to other programs running on mainframe systems, sometimes via MQ, or via batch jobs on large files running at night.
I started mapping services and their dependencies. I drew each service and the sequence of service calls in Visio as sequence diagrams. However, every time I presented a new version of a sequence diagram with our orchestrated service to interested parties, somebody would recall another ancient system that might be connected. This always led to further investigation, and the discovery of more services and dependencies.

A convoluted process
The feeling of frustration still haunts me. I wasn’t frustrated by my teams finding new dependencies, since this was bringing us closer to the goal. Rather, I was frustrated because each small change to the sequence of events caused my diagram layout to collapse. In the end, I resorted to re-drawing all my diagrams by hand, over and over again.
Reducing risk
I also had to make sure that every service orchestration and composite service design delivered on the many, detailed requirements that the business had defined (including non-functional and design constraints).
However, the business side didn’t always understand what something like ‘GL1631’ meant. And, to be honest, neither did I. It was a two-letter and four-digit named program on the mainframe that followed a legacy naming standard from when space and memory were scarce. That meant the business couldn’t understand, nor validate the sequence of events. This increased risk.
So, I made sure that the new services had appropriate names, describing exactly what they did. I also gave the old services new names. However, this meant I also had to keep track of all the technical names and the corresponding new names.
Now, try to include all this information in a series of diagrams, most of which could no longer be contained in a sheet of A4 paper (8.5×11 for the Americans) when printed. I wasn’t able to keep my diagrams up to date any longer, and yet our archeological dig kept bringing new dependencies to light.
Increasing efficiency
The most important things we needed to include in the diagrams were:
- The functional service name
- The integration type
- Their dependencies
However, we also needed to keep track of other important information, such as the requirements they were fulfilling. Eventually, I gave up on Visio and turned to Excel. This allowed me to draw the sequence diagrams on a whiteboard, get stakeholders’ input, and record the changes in a spreadsheet. The spreadsheet we came up with had the following columns:
| Service ID | Requirement # | System | Application | Service | Service name | Integration type | Endpoint type | Criticality | Description | Dependency |
| 1 | F-1 | m34-GL | Ledger | bookTransaction | GL1631 | Asynchronous | MQ | HIGH | Books payment transaction in ledger | :m23-PT:Validation:validateTransaction, :m23-PT:Validation:currencyConversion |
| 2 | F-2 | m23-PT | Validation | validateTransaction | validateTransaction | Asynchronous | MQ | HIGH | Validate a payment transaction | |
| 3 | F-3 | m23-PT | Validation | currencyConversion | currencyConversion | Asynchronous | MQ | HIGH | Adds currency conversion to a payment transactions |
Automatically created diagrams
As the spreadsheet grew, we started dreaming of a tool that could extract the information and draw the sequence diagrams automatically from Excel. However, there was no such tool available.
That’s when I considered what it would be like if everyone could collaborate, add dependencies to their respective services, and in turn see all related diagrams update?
And why stop there? What if everyone could record all the necessary documentation in the same tool? That’s what we did with Ardoq.
Service Integration Template for Excel
You can download the Integration Excel Template here.
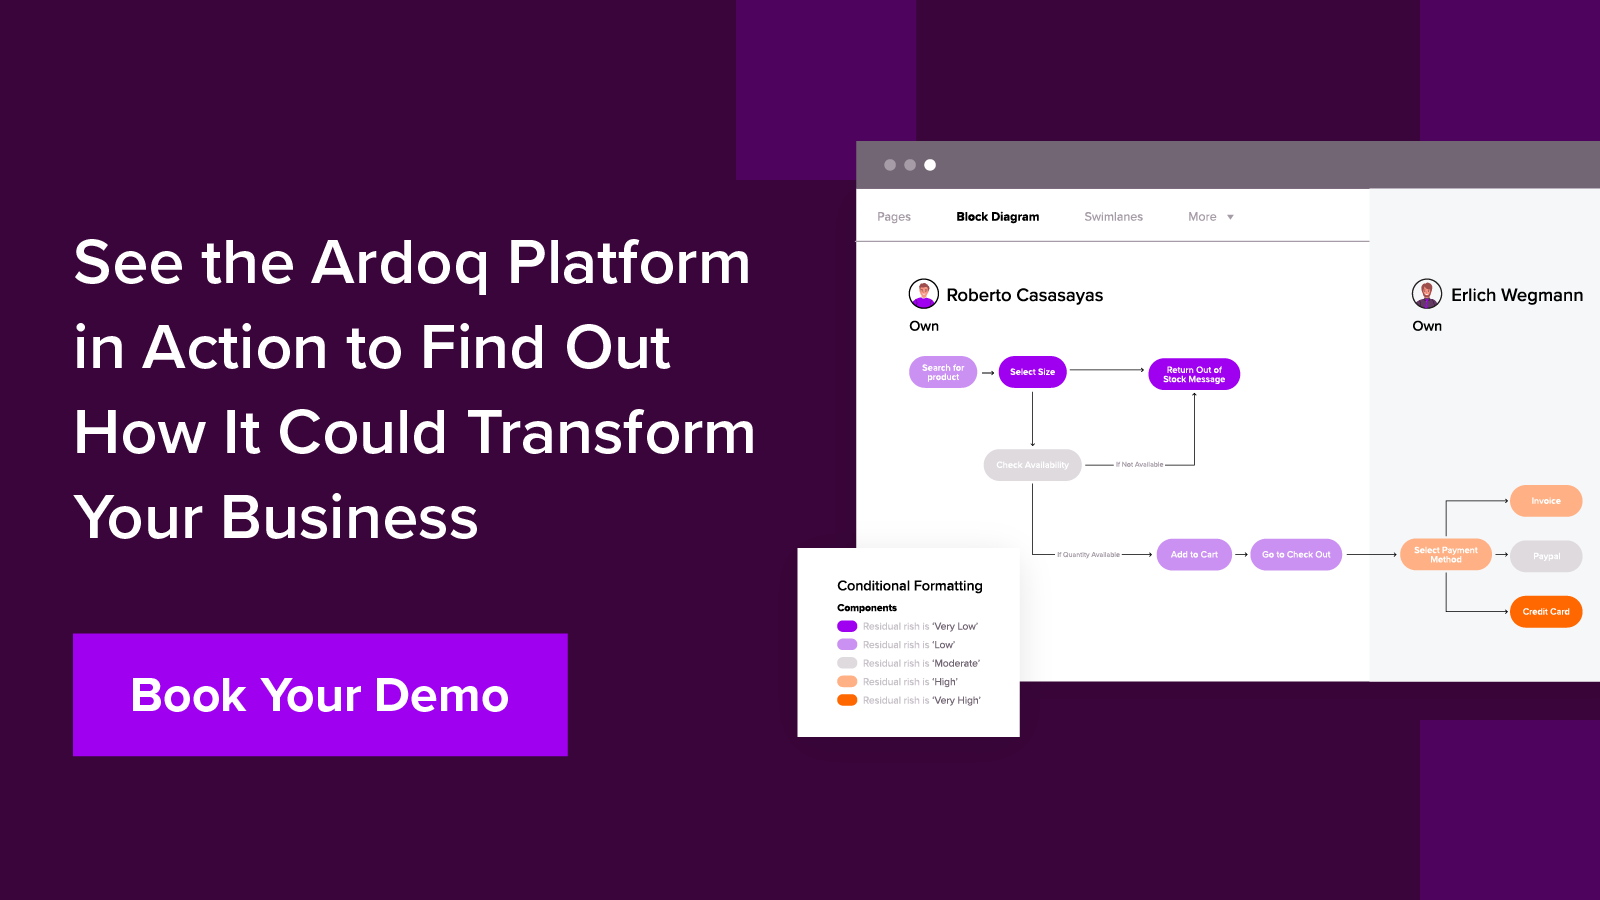
We decided to also improve the Excel import add-on in Ardoq. You can now import an Excel file in Ardoq, and instantly get updated sequence diagrams, process flow diagrams and much more.
See the process in action below:
 Ardoq
This article is written by Ardoq as it has multiple contributors, including subject matter experts.


/Logos/Ardoq/RGB_Ardoq_Logo_Stacked_White_Monochrome%201.png?width=80&height=77&name=RGB_Ardoq_Logo_Stacked_White_Monochrome%201.png)

